
Claim check · Sweeteners
Is honey easier on blood sugar than table sugar?
By glycemic index, slightly; by the spoon, no. Honey’s GI averages 60 against 66 for table sugar, but a tablespoon of honey carries more carbohydrate, so its glycemic load per spoon comes out higher.
Published · Sources checked 27 Sep 2026 · By Assize Index
Summary
- Background.
- Honey is often swapped in for table sugar as the gentler choice for blood sugar.
- What we found.
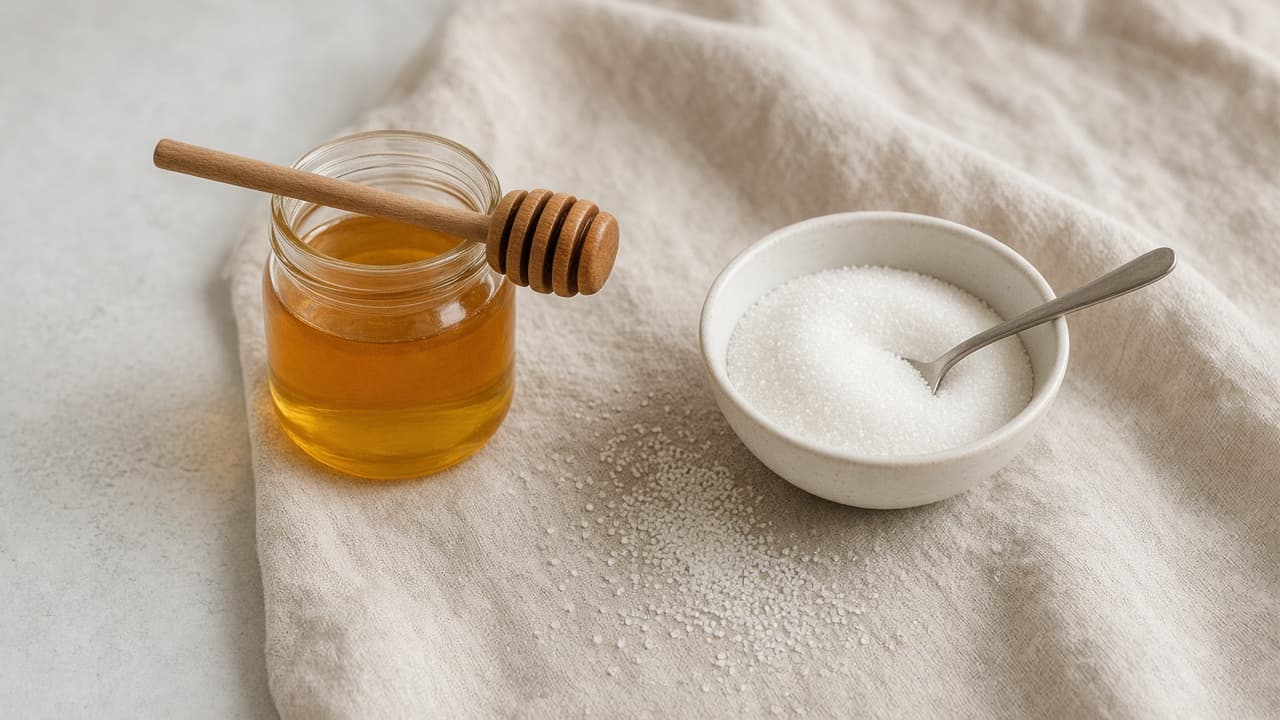
- Pooled GI means are 60 for honey (17 honeys, range 35–74) and 66 for table sugar. A level tablespoon of honey weighs 21 g against 12.5 g for sugar, so its glycemic load per spoon is 10.4 against 8.3.
- What it means.
- Honey’s GI edge disappears at the spoon. Single honeys vary so much that the jar matters more than the average.
The GI numbers
Both averages come from the 2021 international GI tables, which pool studies run under the ISO method1:
| GI (glucose = 100) | Spread across studies | |
|---|---|---|
| Table sugar | 66 (mean of 7 studies) | 59–84 |
| Honey | 60 (mean of 17 honeys) | 35–74 |
The honey spread matters more than the mean. Floral source moves single honeys from 35 to 74, so “honey” is not one number. The jar in your kitchen could sit well below sugar or above it.
Per spoon, not per 100 g
GI compares equal amounts of carbohydrate. You don’t eat honey by grams of carbohydrate, though; you eat it by the spoon. Glycemic load (GI × carbohydrate ÷ 100) accounts for that2,3:
| Per level tablespoon | Weight | Carbohydrate | Energy | Glycemic load |
|---|---|---|---|---|
| Honey | 21 g | 17.3 g | 64 kcal | 10.4 |
| Table sugar | 12.5 g | 12.5 g | 48 kcal | 8.3 |
Honey is denser than granulated sugar, so the same spoon holds more of it. Per 100 g the order flips back (honey 49, sugar 66), but nobody spoons out 100 g.
What we don’t calculate
Many people use less honey because it tastes sweeter to them. If you do, the per-spoon math shifts in honey’s favor. We don’t have a method-cited sweetness ratio for honey against sugar, so we leave that calculation empty rather than guess. Why the chart ranks GI and not glycemic load is on Methods.
Table impact
None. Honey stays ranked on the GI chart with its 2021 mean and range shown. This entry adds the per-spoon view that the GI column alone doesn’t show.
On our tables
References
- Atkinson F.S., et al. International tables of glycemic index and glycemic load values 2021: a systematic review. American Journal of Clinical Nutrition 114(5), 2021 (supplementary table 1, ISO-consistent means). doi.org/10.1093/ajcn/nqab233
- USDA FoodData Central, SR Legacy 169640: honey (per 100 g; 1 tbsp = 21 g), 2018. fdc.nal.usda.gov/food-details/169640/nutrients
- USDA FoodData Central, SR Legacy 169655: sugars, granulated (per 100 g; 1 cup = 200 g), 2018. fdc.nal.usda.gov/food-details/169655/nutrients
Declaration of interests
Assize Index takes no payment or commission from any product or brand named here.
Cite this
Assize Index. Is honey easier on blood sugar than table sugar? Behind the Table, 12 Oct 2026. assizeindex.com/behind-the-table/honey-vs-table-sugar-blood-sugar Reuse terms
Data, not medical advice. For decisions about your own health, talk with a clinician.