
Claim check · Carbs
Is brown rice easier on blood sugar than white rice?
Not on glycemic index: brown rice reads 68 in the international tables, above white long-grain’s pooled 62 — and white reads 73 in that same table, so the order flips by source. Glycemic load per serving nearly ties. Brown rice’s real, documented edge is fiber (1.6 vs 0.4 g per 100 g), not GI.
Published · Sources checked 20 Oct 2026 · By Assize Index
Summary
- Background.
- Brown rice is widely sold as the blood-sugar-friendly swap for white rice because it keeps its bran.
- What we found.
- Brown rice GI 68 (Atkinson 2008) vs white long-grain pooled ISO mean 62 (Atkinson 2021); white reads 73 inside the 2008 table itself. Glycemic load 16.3 vs 17.2 per serving. Fiber 1.6 vs 0.4 g per 100 g.
- What it means.
- Swap for fiber and the whole grain if you like it — not for a lower GI. Variety (jasmine 89, basmati 60) moves blood-sugar numbers more than brown vs white.
The claim
Brown rice is routinely described as the blood-sugar-friendly swap for white rice. Swap if you like the taste and the fiber. Just don’t expect the glycemic index to reward you for it — in the published tables, it doesn’t.
What the tables say
| Rice (cooked) | GI | Glycemic load | Fiber (g/100 g) |
|---|---|---|---|
| Brown rice | 68 | 16.3 | 1.6 |
| White rice, long-grain | 62 | 17.2 | 0.4 |
| Basmati rice | 60 | 16.7 | 0.4 |
| Jasmine rice | 89 | 24.7 | 0.4 |
On our table, brown rice’s GI (68, boiled, from the 2008 international tables1) sits above white long-grain’s primary figure (62, the pooled ISO mean of six foods2). Inside that same 2008 table, white rice reads 73 — so brown is lower in one table and higher against the pooled mean. In other words, rice GI is a band, not a point — and brown does not reliably land under white. Every reading here is for boiled rice, too; nobody has run the same test on the rice from your cooker, let alone fried rice.
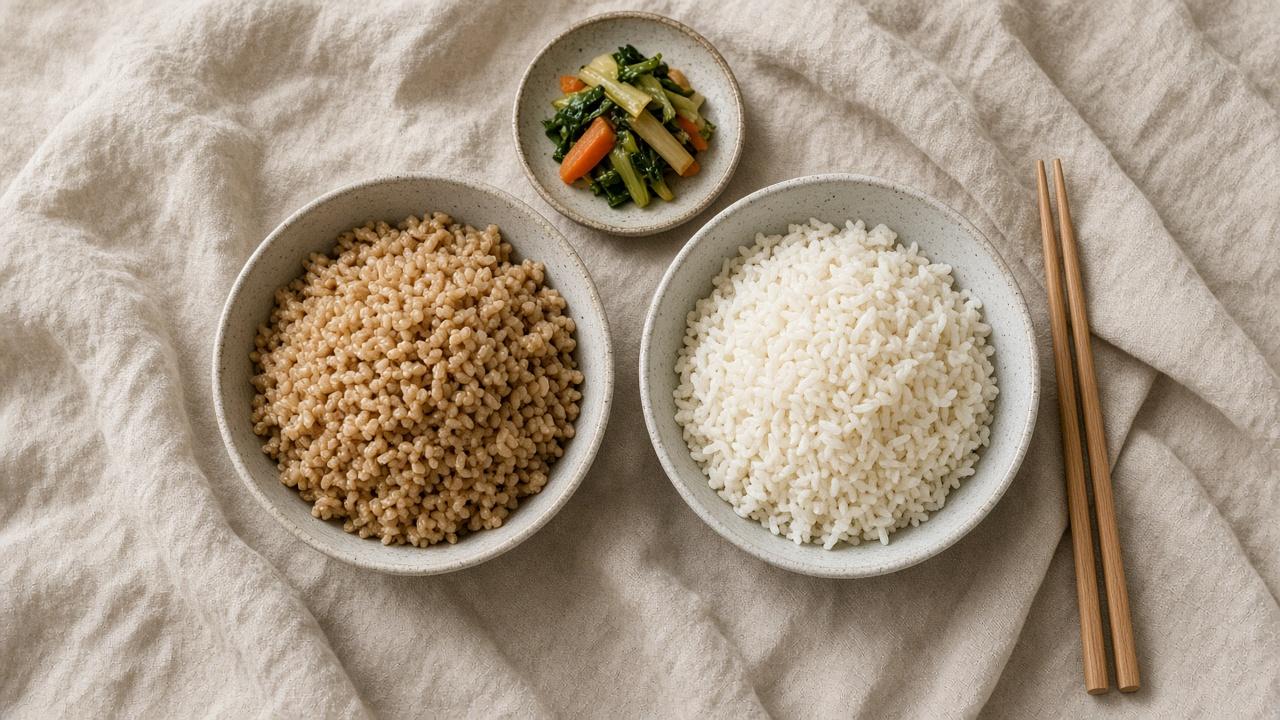
Glycemic load per serving nearly ties (16.3 vs 17.2), because brown rice carries a little less available carbohydrate in the same bowl. Fiber is where the two actually part company: 1.6 against 0.4 g per 100 g. Four times as much, and it is simply the bran that milling takes off white rice.
So what is brown rice actually better for?
- Fiber and the whole grain. That is the documented difference, and it is why brown rice belongs on the whole-grains list and white rice does not.
- Not a GI shortcut. If blood sugar is the question, variety moves the number more than color: jasmine (89) and glutinous rice (92) sit far above both, and basmati (60) sits at the low end. Our Steady blood sugar list ranks on glycemic load first for that reason.
- Portion and company still dominate. GI is measured on the food alone; a bowl eaten with protein, vegetables, and fat is a different meal. Not medical advice.
Full numbers are on the GI chart and the brown rice page; how the lists weigh GI and GL is on Methods.
Table impact
None. These figures are already the GI, GL, and fiber cells on the carb table. This entry reads brown and white side by side.
On our tables
References
- Atkinson F.S., Foster-Powell K., Brand-Miller J.C. International tables of glycemic index and glycemic load values: 2008. Diabetes Care 31(12): 2281–2283, 2008 (Table 1 pooled means). pubmed.ncbi.nlm.nih.gov/18835944/
- Atkinson F.S., et al. International tables of glycemic index and glycemic load values 2021. Am J Clin Nutr, 2021 (Supplemental Table 1, ISO-method pooled means). doi.org/10.1093/ajcn/nqab233
Declaration of interests
Assize Index takes no payment or commission from any product or brand named here.
Cite this
Assize Index. Is brown rice easier on blood sugar than white rice? Behind the Table, 9 Nov 2026. assizeindex.com/behind-the-table/is-brown-rice-lower-gi-than-white-rice Reuse terms
Data, not medical advice. For decisions about your own health, talk with a clinician.